StonebridgeFOCUS | Whose Dow Is It Anyway?
Still one of my favorite TV shows, ABC’s Whose Line Is It Anyway? host Drew Carey would introduce each show with some variation of the following: “Good evening, and welcome to Whose Line Is It Anyway? The show where everything is made up and the points don't matter! That's right, the points are just like the nutritional facts on a Happy Meal.”
Each show had a different introduction, typically with Carey throwing insults or shade at his fellow cast members, such as: “That's right the points are just like tasteful shoes to Ryan Stiles.” There’s actually an entire thread on Reddit listing all of Carey’s one-liners. And just like Whose Line, you could also say the Dow Jones Industrial Average (commonly referred to as “the Dow”) is another place where the points don’t really matter.
All too often, pundits on major financial networks will quote significant changes in major market indices by point totals, instead of percentage terms. Their motivation is not exactly a secret. Quoting points allow for more exaggerated chyrons scrolling at the bottom of your TV and makes for more interesting television. You tell me which is more attention grabbing:
“Dow drops 1,000 points, the third largest point drop in history”
Or
“Dow falls 3.5%, the 114th largest percentage decline in history”
Suffice to say, the point total is a far more compelling storyline. This is especially true when major market indices are experiencing periods of significant volatility, as we’ve seen this past week.
Consider yesterday's (February 27th) 1,190 point drop in the Dow, which represented a 4.4% decline. While certainly unsettling, this doesn't even break the top 100 worst days of the index (#111 in terms of percentage change)1. A 1,000 point drop in 2020 is much different than a 1,000 point drop in 1983, which would’ve been about an 80% decline. The point is that context, perspective, and history matter. No one wants to see the value of their portfolios drop 4% in a single day, but short-term volatility, swings in the market, or even corrections are fairly common and should be expected when investing.
In financial markets, a “correction” is considered a decline of 10% or more in the price of a security from its most recent peak. Corrections happen to stocks, bonds, real estate, or even entire indices, and are part of normal, healthy markets; but sometimes they can feel like distant memories. Can you remember the last market correction? Most people can’t. However, history tells us that market corrections occur every 1.86 years2.
The last major market correction in stocks occurred on December 17th, 2018, or about 1.2 years ago. It’s not surprising most don’t recall the last correction, particularly since what followed was a year of stellar equity returns. From December 18th, 2018 until the end of 2019, the S&P 500 increased 26.9%3. Those who weathered the storm, recovered their losses and enjoyed the upswing. But what happened to those who sold? How did they know when the buy back in again?
No one can predict when a correction will occur or how long it will last, at least not with any reasonable certainty. Even attempts at timing the market are ill-advised, since you have to be right twice: when to get out, and when to get back in. This is why you don’t see day traders or stock pickers on the Forbes® list of wealthiest individuals.
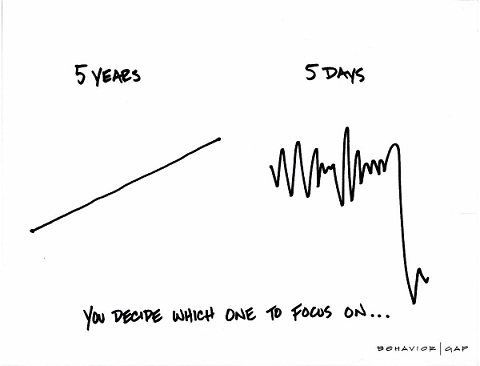
There’s a common saying that “trust takes years to build, but only seconds to break.” Similarly, it takes time for your goals to grow, with market corrections tilling the soil along the way for a greater harvest. However, those goals can be quickly derailed by a momentary lapse in judgement. Wealth is not built by timing markets and goals are not achieved by focusing on short-term setbacks. The best way to combat the noise and navigate the ups and downs of the market is by having well defined goals which capture what’s important to you and your family.
Thank you for your continued trust and confidence in Stonebridge, where your goals are the only thing that matter. If you’d like to learn more about goals-based wealth management, please feel free to reach out to our team.
Best,
Tyler Martin, CFP®
[1] Source: Dow Jones Market Data.
[2] According to data aggregated by market analytics firm Yardeni Research, the S&P 500 has undergone 36 corrections of at least 10% since the beginning of 1950.
[3] Source: Morningstar.