Market Notes | History Shows That Stock Gains Can Add Up after Big Declines
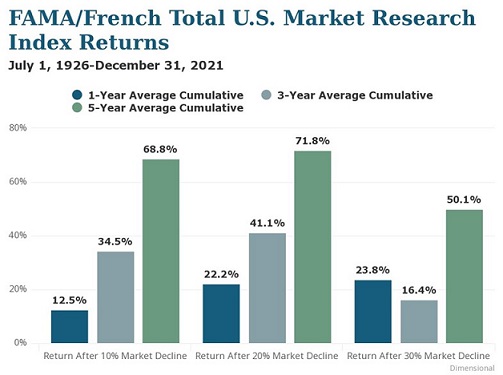
Market downturns can be unsettling, particularly for creators and influencers with irregular cash flow. However, you can find certainty in uncertain times. You don’t have to predict the future to achieve your career, life, and wealth goals. You don’t have to live in fear and uncertainty. You can enjoy the journey and the creator economy with peace of mind today and greater confidence in the future. But it requires knowledge and commitment. A broad market index tracking data since 1926 in the US shows that stocks have tended to deliver positive returns over one-year, three-year, and five-year periods following steep declines. Cumulative returns show this trend to a striking effect, as seen above.
On average, just one year after a market decline of 10%, stocks rebounded 12.5%, and a year after 20% and 30% declines, the cumulative returns topped 20%. Over three years, stocks bounced back more than 30% from declines of 10% and 20%, although—while still positive—returns were not as impressive after 30% declines. But five years after market declines of 10%, 20%, and 30%, the average cumulative returns all top 50%1.
The best investors and their advisers prepare for market volatility, dramatic ups and downs, and turn it to their advantage. The data makes a compelling case for commitment to your achievement-based financial plan; to get in and stay in the market for the long-term2.
Cheering you on,
Mitch Martin
1In USD. Market declines or downturns are defined as periods in which the cumulative return from a peak is –10%, –20%, or –30% or lower. Returns are calculated for the 1-, 3-, and 5-year look-ahead periods beginning the day after the respective downturn thresholds of –10%, –20%, or –30% are exceeded. The bar chart shows the average returns for the 1-, 3-, and 5-year periods following the 10%, 20%, and 30% thresholds. For the 10% threshold, there are 29 observations for 1-year look-ahead, 28 observations for 3-year look-ahead, and 27 observations for 5-year look-ahead. For the 20% threshold, there are 15 observations for 1-year look-ahead, 14 observations for 3-year look-ahead, and 13 observations for 5-year look-ahead. For the 30% threshold, there are 7 observations for 1-year look-ahead, 6 observations for 3-year look-ahead, and 6 observations for 5-year look-ahead. Peak is a new all-time high prior to a downturn. Data provided by Fama/French and available at mba.tuck.dartmouth.edu/pages/faculty/ken.french/data_library.html.
2Investments involve risks. The investment return and principal value of an investment may fluctuate so that an investor’s shares, when redeemed, may be worth more or less than their original value. Past performance is not a guarantee of future results.